PDOS
PDOS stands for Partial Density of States. PDOS.py is a program which automatically extracts information from Gaussian (http://www.gaussian.com/) output and calculates PDOS based upon Lowdin or Mulliken orbital analysis.
The first version of the program was written in January 2011 as part of a bachelor project under the supervision of Prof. Mark E. Casida at the Joseph Fourier University (Grenoble I), France.
Another program with this functionality is the Python program GaussSum (http://gausssum.sourceforge.net/) and PDOS.py has been checked against GaussSum.
An advantage of PDOS.py is that you can plot multiple PDOS as well as the total density of states (DOS) on the same graph. We needed this for our project and it does not seem to be very easy to do with GaussSum.
GaussSum and PDOS.py differ in their definitions of the gaussian convolution which is done. In GaussSum, the gaussians always have unit HEIGHT. In PDOS.py, the gaussians always have unit AREA. This latter choice seems more logical to us. This means that the ratio of peak heights calculated with GaussSum to that of PDOS.py is,
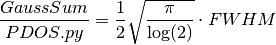
where FWHM is the full width at half maximum. For example of applications see [Wawire2013a] and [Magero2017].
Partial Density Of States
The DOS is the function,
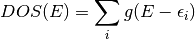
where  is a gaussian with fixed FWHM and
  is the energy of the
  -th molecular
orbital (MO). The formula for the PDOS of the
-th molecular
orbital (MO). The formula for the PDOS of the  -th atomic orbital (AO) is
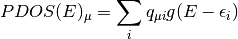
where  is the Mulliken charge of the
  -th AO in the i-th MO. It is
calculated as
-th AO in the i-th MO. It is
calculated as
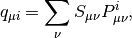
where

is the AO overlap matrix and
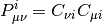
is the -th MO density matrix calculated from the MO coefficient matrix,  .
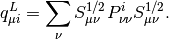
Alternatively, we propose to calculate PDOS from Löwdin charges to avoid
possible negative PDOS. Löwdin charges can be calculated as
.
Alternatively, we propose to calculate PDOS from Löwdin charges to avoid
possible negative PDOS. Löwdin charges can be calculated as
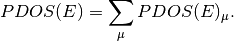
Normally we are interested in the PDOS for a group of orbitals (such as all the d orbitals on a Ruthenium atom). In that case, the appropriate PDOS is obtained as a sum over the PDOS of all relevant orbitals,
Information from quantum chemistry packages
The central function of the PDOS program, calculate_and_plot_pdos(),
requires information from a quantum chemistry calculation.
In the current version, this information is assumed to be comming from
the Gaussian package. This information is read through the function
get_gaussian_info().
This function is going through the output file generated by Gaussian. It is imperative that Gaussian has been run with the right options so that all needed information can be extracted from output file. We thus recommend the following options:
pop=full iop(3/33=1,3/36=-1)
The output file should then include,
The number of basis functions and electrons in the system (closed shell is assumed),
Nbasis = xxxx
xxx alpha electrons
The overlap matrix preceded by the line,
*** Overlap ***
The eigenvalues and the molecular orbital coefficients. preceded by the lines,
Molecular Orbital Coefficients
EIGENVALUES
Alternatively, a new function (similar to get_gaussian_info())
can be added to the code in order to extract the relevant information
from another quantum chemistry package.
Installing and running PDOS.py
To run the PDOS script, you must first create a text file with the orbital groups
for which you want to plot PDOS. This file has the following format,
s orbitals
1,2,6,10,11,15
p orbitals
3-5,7-9,12-14,16-18
Here the lines s orbitals and p orbitals are labels for each PDOS curve. What
follows is a index list of the AOs whose individual PDOS will be summed to make the curve.
The AOs are in the same order as in the Gaussian output file.
For convenience, you can create this file with the Python script group_of_AOs.
Just type,
group_of_AOs gaussian_file
and follow the instructions. You should then be ready to use the PDOS script as follows,
PDOS gaussian_file group_of_AOs.inp
The use of default parameters is recommended. The graphical interface can also be used, (it might be more convenient to change the default settings such as the energy range or the FWHM.). In order to access the GUI just type in your terminal,
PDOS_GUI
then there will be a pop-up graphical interface with boxes to fill in,
only the two input files are required, the other field can be left
intact in order to use the default parameters.
Click on the button marked PLOT and wait for it.
Example
In the test directory of the PDOS repository, you can find a Gaussian output
file for the nitrogen molecule, N2.log as well as a file containing subset of
atomic orbitals group_of_AOs.inp generated by the python script group_of_AOs.
Those files can be used to test the calculation of PDOS using the PDOS script.
Proceed as follows,
enter the test directory (from the root directory PDOS),
cd test/
execute the program,
PDOS N2.log group_of_AOs.inp
Use default parameters for plot? y/n [y]:
accept the default settings by pressing enter. You should see the following run time prints,
Number of basis functions   =  18
Number of occupied orbitals =  7

Reading Overlap and MO transformation matrices...
Gaussian output file parsed
Calculating Lowdin partial charges...
Reading group of AOs file:  group_of_AOs.inp

Gaussian convolution of data...
xmax =  66.578307481  [eV]
xmin =  -395.511603391  [eV]
npts =  46208
FWHM =  1.0
norm =  0.9394372787
alpha =  2.77258872224

Convolution of data done!
Finally, a window should pop up containing a graph of the DOS and PDOS of the nitrogen molecule. By zooming on the HOMO-LUMO gap region you should see a similar plot as the one in the test directory denoted
N2_PDOS.png. This figure has been produced by gathering the AOs with sigma symmetry under the green curve (s and pz AOs) while the blue figure represent the pi orbitals (py and pz AOs).
Modify the display parameters
The plots are made by the function plot_dos_and_pdos().
It should be rather easy to change the display parameters such as curve colors and styles,
legend, labels, title… by simple modifications of that function.
PDOS code documentation
-
plot_dos_and_pdos(nocc, eps, xmin, xmax, xpts, groups, pdos, gaussian_file, plot_dos, dos)[source]¶ plot DOS and PDOS: This routine can be modify to alter the final display of the graph
-
calculate_and_plot_pdos(gaussian_file, group_file, npts=0, fwhm=1.0, xmin=1, xmax=-1, plot_dos=True, mulliken=False)[source]¶ Calculate and plot partial density of states (PDOS)
This function read a gaussian output files containing the necessary information for calculating total and partial density of states. The DOS and PDOS are then calculated and plotted.
References
| [Wawire2013a] | Muhavini Wawire, C. et al., (2014). Density-functional study of luminescence in polypyridine ruthenium complexes. Journal of Photochemistry and Photobiology A: Chemistry, 276, 8–15. http://doi.org/10.1016/j.jphotochem.2013.10.018. |
| [Magero2017] | Magero, D. et al., (2017). Partial density of states ligand field theory (PDOS-LFT): Recovering a LFT-like picture and application to photoproperties of ruthenium(II) polypyridine complexes. Journal of Photochemistry and Photobiology A: Chemistry, 348, 305–325. http://doi.org/10.1016/j.jphotochem.2017.07.037 |